
jEdit
3. Debugging Interface for Sentaurus Structure Editor
3.1 Using the Debugging Interface
Objectives
- To describe the debugging interface for Sentaurus Structure Editor.
3.1 Using the Debugging Interface
jEdit offers a debugging interface for Sentaurus Structure Editor. This allows you to send selected text from jEdit directly to Sentaurus Structure Editor, and to evaluate the text without having to continually switch between Sentaurus Structure Editor and jEdit to copy lines, as shown in Figure 1.
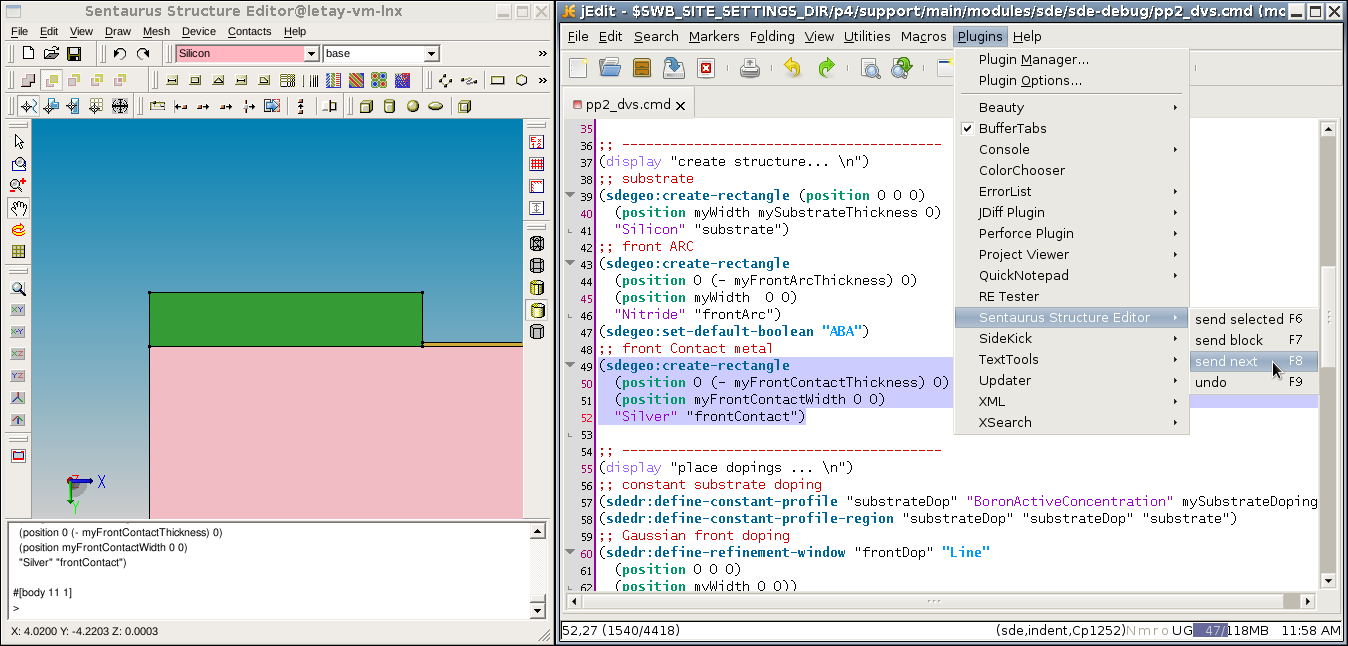
Figure 1. Debugging interface for Sentaurus Structure Editor. (Click image for full-size view.)
You have different ways in which to invoke the Sentaurus Structure Editor debugging mode:
- In a shell, type:
sde -editor <filename>
- Open Sentaurus Structure Editor, and choose Edit >
Text Editor.
The jEdit interface linked to Sentaurus Structure Editor opens. Here, you can open the file of interest. - In Sentaurus Workbench, open the Node Explorer for the node of interest, and
select the pp*_dvs.cmd file. In the Viewer field, select
sde and click Launch.
This opens Sentaurus Structure Editor and jEdit with the debug link established.
Before starting Sentaurus Structure Editor in debugging mode, ensure that all jEdit instances are closed. Otherwise, the link cannot be established.
The customization package offers different debugging commands, available from the menu bar by choosing Plugins > Sentaurus Structure Editor:
- send selected (or press the F6 key)
Sends the current jEdit selection to Sentaurus Structure Editor. This is useful to investigate the result of a selected expression (for example, a variable). - send block (or press the F7 key)
Selects the command block with matching parenthesis pairs at the current cursor position, selects it, and sends it to Sentaurus Structure Editor. This is useful for stepwise evaluation of a complex nested command, by placing the cursor inside the innermost parenthesis and pressing the F7 key successively. - send next (or press the F8 key)
Tries to find the next command block relative to the current cursor position or selection, selects it, and sends it to Sentaurus Structure Editor. This allows you to smoothly move through a command file by pressing the F8 key successively. - undo (or press the F9 key)
Sends the Scheme command (roll) to Sentaurus Structure Editor, which corresponds to clicking the Undo button in Sentaurus Structure Editor.
The debugging command send next ignores comments at
the end of the line. Placing the cursor above the following line:
(set a 1) ;; (set b 2)
and calling send next twice evaluates both expressions, setting
a=1 (as expected) as well as b=2.
To enable shortcuts for the debugging commands, follow the steps in the Download and Installation Instructions section of the customization package (see Section 1.2 Downloading the Customization Package):
In addition to the command file of Sentaurus Structure Editor, a mode for the CSV file required for the sdeepi Scheme extensions of Sentaurus Structure Editor is available. The mode contains all the global variables and helps to recognize columns by introducing alternating colors (black and red) for layer values in different columns.
Copyright © 2022 Synopsys, Inc. All rights reserved.